

Welcome back to Part 4 of my Backup Internals series. Today, I’d like to spend a little time exploring backup compression.
When you take a regular FULL BACKUP, SQL Server is literally taking a byte-for-byte copy of your data files. Don’t believe me? Then go read this, then come back. Additionally, Microsoft architected BACKUP operations such that the resource utilization and impact would be minimal (when using default parameters).
Back in the Day
Back in the days of my youth, storage cost a heck of a lot more per megabyte (hahaha). And backups were extra copies of your data that had to live somewhere. So who would not want their backups to consume less (expensive) storage? But alas, Microsoft did not offer built-in BACKUP compression with SQL Server in its earlier days. Instead, data professionals had to resort to 3rd party products like Litespeed to have compressed backups. Investing in a software solution often outweighed the extra storage costs of an uncompressed backup, so it was a sensible expenditure. Unfortunately for backup software vendors, Microsoft introduced native backup compression in 2008.
Costs of Backup Compression
Regardless of how one does compression, it comes at a price. Compression reads and manipulates ALL OF YOUR DATA to make it smaller, which requires CPU and memory resources. The benefit is that SQL Server now has less data to send over the wire to your backup target, reducing required storage and (usually) overall execution time. And this (usually) made both DBAs and storage admins happy.
In our last two blog posts, we explored a BACKUP operation’s RAM and CPU worker thread utilization. But what happens when you turn on compression?
The answer for RAM and backup buffers is easy – compression requires 3x whatever backup buffers you were using already. So if a regular BACKUP operation needed 10MB of RAM for backup buffers, turning on compression will now use 30MB of RAM. The buffers themselves do not get larger, rather the number of “Sets of Buffers” goes from 1 to 3.
Digging Deeper: Compression and CPU Utilization
When utilizing compression, most of us know full well that SQL Server burns a lot more CPU. But how much CPU? Does it just burn more cycles on the same Reader & Writer threads that were invoked as normal? Or does it invoke additional threads to do compression work?
To dig a bit deeper, I turned to my good friend Sysinternals’ Process Explorer. If you’re not familiar with it, it’s essentially Task Explorer on steroids. One awesome thing you can do with it is right click a given process/.exe, go to Properties, and see Thread information!
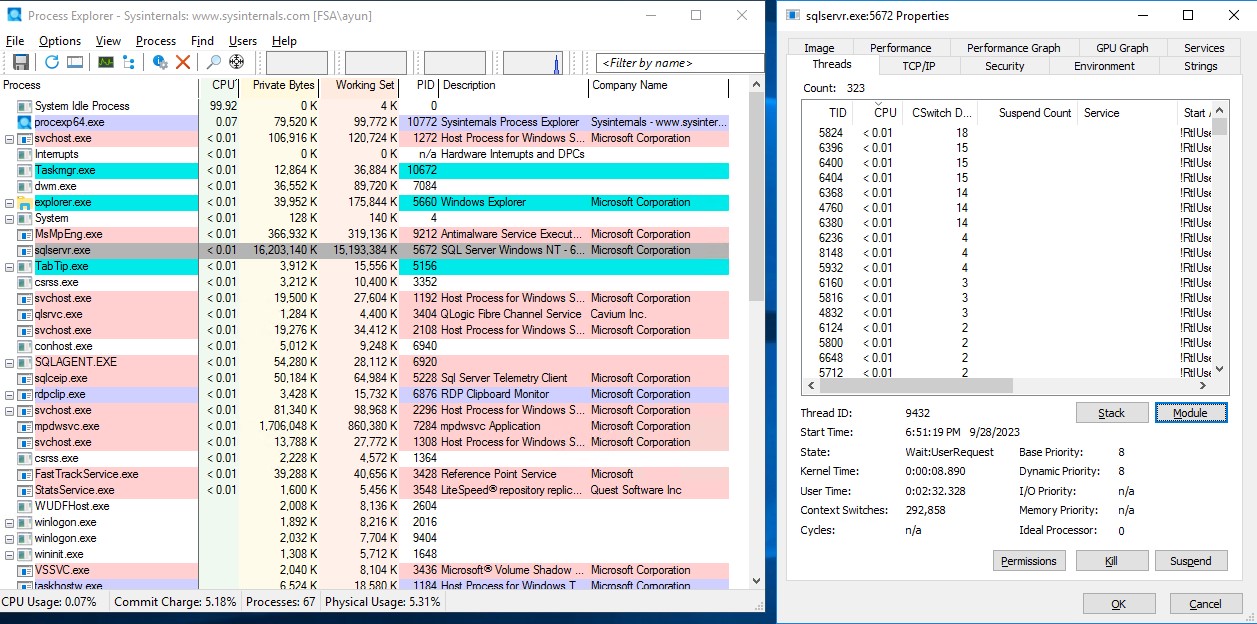
Using this, I can at least see the number of threads that are actively using CPU at any given time. Here’s a baseline shot showing an otherwise idle SQL Server

Note that there are threads “using” CPU, but they’re all marked “< 0.01”, so for purposes of this simple analysis, we’ll consider them idle.
Next, this is what the output looks like when I execute a BACKUP operation, whose files are on a single volume, against a single backup target, with no compression:

Note that there are two threads (ThreadID or TID): 10636 & 5176, showing CPU utilization values that are not “< 0.01”. That’s indicative of my 1 Reader thread and 1 Writer threads for my BACKUP operation.
Now as a different control, I executed a BACKUP whose data files are on 4 separate volumes, against 1 backup target, with no compression.
Note here that I see activity on 5 threads: 4 reader threads and 1 writer thread.
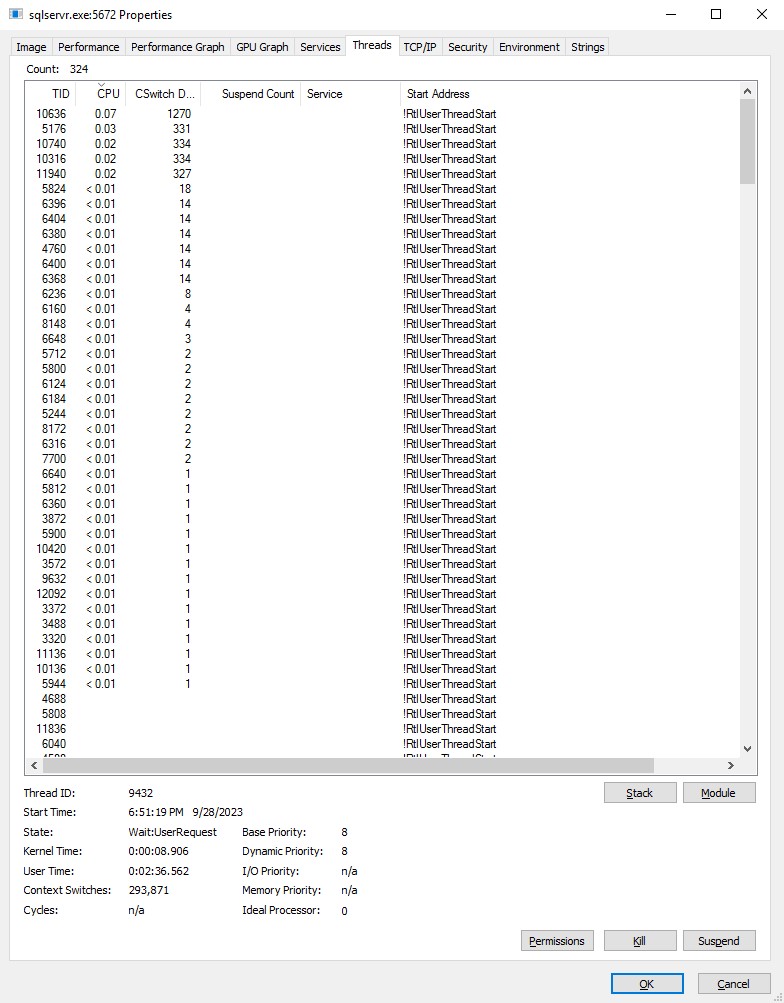
Finally, here’s a BACKUP run with a single volume, single backup target, but with compression turned on.

That’s a heck of a bunch of threads that are not idle – over 20 in this screenshot!
How Many CPU Threads Does Compression Need?
I’ll come right out and say it; I’m not certain. Here’s the thing about the above observation methodology. It updates once per second and while it’s insightful, it’s not bulletproof.
For one, I cannot confirm with absolute certainty, that the given threads are related to the BACKUP operation. In fact, for my single volume, single backup target control, I’d occasionally get a sampling that would have a 3rd thread pop up with some activity, but only for a single snapshot. In multi-volume and/or multi-backup target examples, the number of threads active at any one time would occasionally drop below what I would expect. I attribute that to a CPU thread having to wait for a resource at that precise moment in time.
If I wanted to get deeper, I suspect I’d have to go attach a debugger to SQL Server and go digging to find the actual discrete calls that are invoking additional worker threads. But for the purposes of this blog, I’m content with the above observation that when using compression, many more CPU threads get spun up.
Compression: Yay or Nay?
As we’ve seen, Backup Compression requires more resources – CPU and memory. And unless someone else is willing to fill in the gaps, I cannot tell you the algorithm/methodology to better predict CPU thread utilization when it comes to utilizing Compression. But I would also argue that one should not let that deter you either.
In the end, everything is all about trade-offs… which is what Part 5 of this series will be all about – performance trade offs of using all of these different backup parameters.
Thanks for reading!

2 thoughts on “Backup Internals – Part 4: Backup Compression”